Plots
We provide several plots for the validation of retrieval quality.
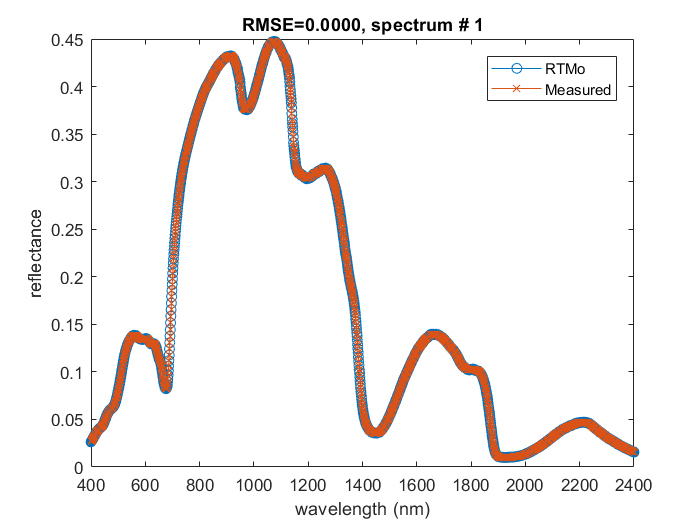
Reflectance
Modelled and measured reflectance curves show if the modelled curve is close enough to the measured curve.
As there might be many spectra we do not show all the figures immediately after the run finishes
but we save them all in the matlab graphical array named figures with plot.reflectance_hidden()
To actually see them set visibility property of the j-th figure to ‘on’:
set(figures(1), 'Visible', 'on')    % show the plot for the 1st spectrum
set(figures(5:7), 'Visible', 'on')  % show the plots for the 5, 6, 7 spectra
set(figures, 'Visible', 'on')       % show the plots for all spectra
If you close the figure (by pressing the upper right red cross) it will also disappear from figures array;
in fact there will be “handle to the deleted figure”.
Note
You can draw all these plots again from the “%Y-%m-%d_%H%M%S.xlsx” file with plot.replot_all()
Validation (1 : 1)
To see how well the retrieval worked for your spectra you can provide validation on Filenames tab.
- Validation file requirements:
first columns - parameter names as they are on
Inputtabother columns - measured values of this parameter for each spectra.
Overall the number of columns in validation file equals to the number of columns in the reflectance file +1 for parameter names.
Example:
names |
spec_1 |
spec_2 |
spec_3 |
LAI |
1.0 |
NA |
1.5 |
Cab |
40 |
30 |
50 |

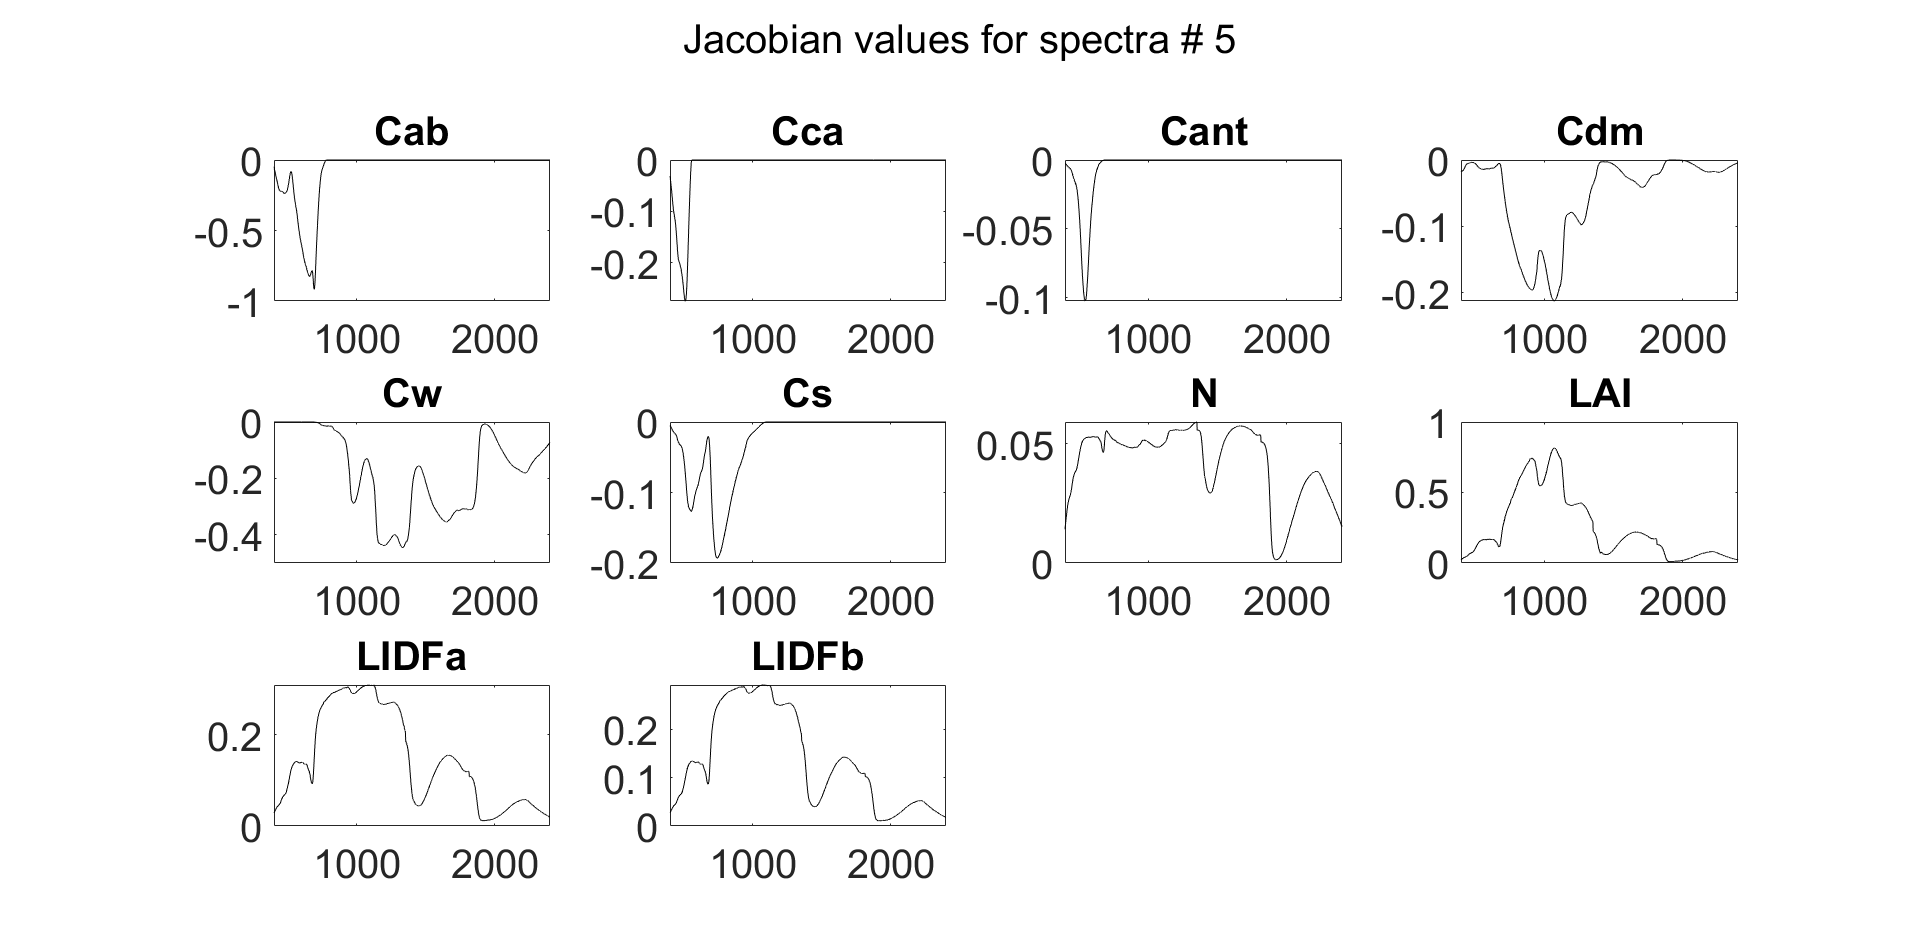
Jacobian
The algorithm of local minimum search lsqnonlin() uses the gradient descent method
where the next step is driven by the cost-function partial derivative matrix - Jacobian matrix.
For each spectra we calculate the Jacobian matrix at the last step of optimization to propagate standard deviation of reflectance to that of the retrieved parameters.
Jacobian can be plot with plot.jacobian(J_all, tab, measured.wl, j)() and
its SVD (singular value decomposition) can be plot with plot.jacobian_svd(J_all, tab, measured.wl, j)() for j-th spectra.
Note
We do not write the Jacobian matrix to file. If you want to analyze it plot it immediately after the model run or save as the .mat file yourself.